 |
| iNaturalist data, Google Tile Set, and QGIS mapping of Asimina species observations of the viewed part of the United States. |
4/23/2018 Been a while since a post, here is a good one for mapping.
iNaturalist is a site, a movement to map the organisms of the world. I think through an app on smart phones, you can take pictures and record GPS coordinates, then upload what you find to the web. Others review your post and can help identify what you found. Then people can see what and where you found the organism.
So for example, if you want to see all the locations of zebras, species Equus zebra, you can search and it will give you a map. This is an screen shot part of the iNaturalist site looking at Equus zebra.
 |
| Map generated through iNaturalist for Equus zebra. iNaturalist.org web application at http://www.inaturalist.org. Accessed 23 April 2018. https://www.inaturalist.org/taxa/43330-Equus-zebra. |
Since I am all about plants, I will focus on the Paw-Paw, Asimina species. No I am not talking about the 1985-1986 cartoon with native American bears fighting off the Dark Paw, I am talking about a plant. There are a few species of Paw-Paw. People eat the fruit of the most widespread species, Asimina triloba. But let us practice with an example:
Go to https://www.gbif.org/occurrence/search.
On the left side, begin to open the taxonomic tree by clicking:
Scientific Name
Plantae
Tracheophyta
Magnoliopsida
Magnoliales
Annona
Asimina
Then you can click the number of observation beside the text "Asimina." yesterday it was 4,513. Today it is 4,530. So more observations are being added all the time, even for this plant.
 |
| Example from gbif.org part of the iNaturalist stuff showing observations for Asimina, Paw-Paw. |
From here I clicked download.
Click the button for the download of the csv file. Click Understood.
Then I waited for an email. A minute or two, I received the email. I clicked the link provided in the email for the download of the data and saved it.
The saved file was a zip file, I just right clicked and unzipped it.
I then opened Excel. In Excel I clicked the "Data" tab. Then I clicked the "From Text" option. I navigated to the unzipped file and selected the csv file. Within the "Text Import Wizard" for file origin I selected Unicode (UTF-9). I clicked next, next, finish. This imported the information into the Excel spreadsheet. I then saved the file as a .csv (comma deliminated). I closed Excel.
I opened QGIS:
From the top, I selected "Layer."
Then I clicked "Add Layer"
Then "Add Deliminated Text Layer."
I browsed to the csv file I had just saved from Excel and doubled clicked it. The QGIS program loaded the information and auto filled the X and Y fields. The Encoding was automatically selected to UTF-8. I then clicked the button to Add the layer. This added points, the location of Asimina plants.
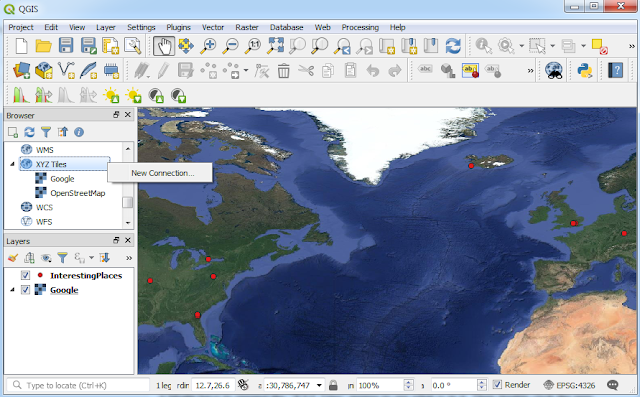
Within the QGIS Brower, I selected the XYZ Tiles option, then doubled clicked Google. I discussed setting this up in a previous post. The instruction listed again:
1.Within the "Browser" section, scroll down to "XYZ Tiles."
2.Right click "XYZ Tiles" and select new connection.
3.In the pop-up window, for Name you can type Google. in the URL enter: http://www.google.cn/maps/vt?lyrs=s@189&gl=cn&x={x}&y={y}&z={z}. Set Max. Zoom Level to 19. Click ok.
4.Might have to expand the "XYZ Tiles" menus to see what is in it. Then double click the new Google option to add it to the map.
I then added the picture of the world and refreshed to that the points would go to the correct place.
 |
| iNatural data and Google tiles within QGIS showing locations of Asimina plants observed and recorded throughout the world. |
I zoomed into Eastern North America. Ont he left side of QGIS, I double clicked the symbol of the points, I changed the symbol from Single to Categorized. For Column I selected Species. I clicked apply, then I clicked Classify and unchecked the very bottom symbol.
 |
| iNaturalist data, Google Tile Set, and QGIS mapping of Asimina species observations of Eastern North America. |
This shows all the species colored in different points. Most of the points are of Asimina triloba. Asimina diversity, different species, are mostly found in the southeastern United States.
 |
| iNaturalist data, Google Tile Set, and QGIS mapping of Asimina species observations of the viewed part of the United States. |
Using the key at the left, you can look at the map to view where different species are located.
The Paw-Paw, Asimina, is one of my favorite plants! Everyone should "get a hit of" the smell of leaves of plants of this genus.
It is nice to see the work of many people to obtain these points and the work of others to make this data available! This could be done for countless other species. The website has statistics on how many species and observations, and it is growing every day. I hope this material will be around for a long time as this has the potential to be powerful information. This type of data goes beyond government, scientists, and industry. This is open and free for anyone!
I don't personally contribute to iNaturalist, but it could be cool for others.
Thanks for reading!
Comment if you would like!
Ask questions if you have any.
If you made a map using QGIS and iNaturalist, take a picture and contact me and I will post it on a future blog!
Thank you and have a Great day!
